General |
Statistical Finance
R Squared


Introduction
The objective of this article is to get an understanding of R2 and what is the optimum value for this parameter in interpreting results.
“Is there any specific range for R2 that can be said to be optimum?” and “Does a High R2 value an indicator of a better model relative to Low R2?”, We will discuss these queries and analyse them to get a suitable conclusion.
R² – Meaning & Interpretation
The R2 can be interpreted as “the percentage of the variance in the dependent variable that is explained by independent variable collectively”. In simple terms, it can be expressed as “Out of total variance in the dependent variable the proportion that is explained by the Independent variable” *[Explained variance/Total variance]
R² Value -A Beautiful illusion
As you got the idea of the R2, you start correlating the efficiency of the model to the higher value of R2. In short, the higher the R2 the more efficient the model is and the highest R2 possible should be relatively the best model as it explains most of the variance in the dependent variable.
This is not so simple in reality, and just the high value of the R2 does not justify the efficiency of the model. The assumption is completely flawed and there can be various issues with the higher value of the R2. The R2 is not sufficient in itself to claim the superiority of the Regression model and we need other technical reports attached to the R2 report to gain insight.
Similarly, a Low R2 can be a good model, as some fields of study have an inherently great amount of unexplainable variance. In these areas, the values of R2 are bound to be lower. For example, Studies that try to explain Human Psychology generally have a Low R2 value. This is in agreement with the fact that the human mind is difficult to predict in contrast to the physical process. But even in such a case wherein the model has a low R2 value but the independent variables are statistically significant, you can still make conclusions based upon the relationship between variables and it is vital wherein innovation and unexplainable phenomena are being tried to explain in context to any subject area. Thus, a high R2 not always implies a good model and vice versa.
Few citations that report a low coefficient of determination (R-squared) in a study of human psychology:
- Barnett, L. A., & Henderson, R. K. (2006). The prediction of psychological distress by cognitive, social, and self-regulatory processes: A prospective study examining the role of self-esteem, resilience, and hopelessness. Personality and Individual Differences, 41(3), 555-567.
[In this study, the R-squared value for the prediction of psychological distress was reported to be 0.28, indicating that the predictors accounted for only 28% of the variance in psychological distress]
- Kline, R. B. (2011). Principles and practice of structural equation modeling.
[Click on the link below to access the report- Link ]
[The literature reports that R-squared values in social science research are often low, typically ranging from 0.10 to 0.30. This suggests that many social science phenomena are complex and influenced by a variety of factors that are difficult to measure and predict accurately]
[ Important Note: There are some scenarios where low R2 can cause problems such as where a great deal of precision is required, for e.g.- Elon musk space company SpaceX analysing the relationship between “atmospheric drag” and “time taken” to execute the placement aspects. For placement in the orbit, The R2 should be sufficiently high, backed up with great technical aspects( Random residual pattern around “0” residual value) as precision is of utmost importance. ]
Residual Pattern Analysis – Insight on exposure to specification bias (Needs to be Attached with R-squared report)
A residual plot analysis will give a better insight to fetch more technical aspects of the model. As mentioned earlier that alone R2 fails to give any insight regarding the model. For better insight, we will do a “residual-plot analysis” and “study the pattern of the residuals”.
To do such an analysis we take two axis “x” and “y”, On the x-axis we will take the independent variable, (predicted values) and, on the y-axis, we will take the residual values. Just to make things clearer,
residual = y – ŷ
The residual plot gives a visual validation to the model under study by observing the residual patterns along the “0” level mark of residual value. If the scatter is random [no observed pattern] along the axis, we interpret this as a “Green flag” and good to go with an unbiased model. On the other side, if the scatter of residuals has a certain pattern this is a “Red flag”, and it should be meant the model is not the right fit or is a bad fit despite a high R2.
The red flag raised gives an insight that the model has an issue. In other words, it is missing significant independent variables or/and polynomial terms or/and interaction terms. [“or” & “and” can have any permutation and combination]
[Note: An unbiased model has residuals that are randomly scattered]
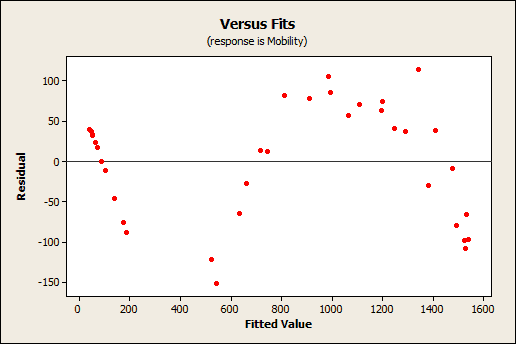
Fig: Non-Random Residual Pattern demonstrated in the Residual plot indicating “Red Flag” [Biased Model]
Conclusion – A Holistic approach
The approach of asking the question “What is a good R2 value” is an ignorance of “permutation & combination of factors linked to the Model”. The R2 is not sufficient to answer the model validity. When combined with Technical & Subjective parameters it conveys a better validity.
In essence, the holistic approach gives confidence in the model’s reliability. There is no such pre-defined R2 value that is optimum or crossing a threshold R2 the model becomes efficient, rather it depends on technical aspects attached as we discussed the Model validity [Residual plot analysis] and subjective criteria such as Field of study “the inherent nature” of the variable under study and maybe some other parameter too [like anticipated precision level].
Thus, a holistic view gives a better perspective on the Regression Model rather than just the value of R2 which is incomplete to make any judgement on the quality of model. So, we can conclude that there is no such R2 value that is good but a holistic view that is required for a model to be analysed. [ignoring the precision factor].